Load Testing
Load testing is a crucial part in the final testing phase of a software product and should be done for every application where a large number of concurrent users is expected. Since there are plenty of tools available for this purpose, the main objective remains the same. It is important to recreate realistic user paths and scenarios in order to obtain meaningful results for bottleneck analysis. Most of the time it is not easy to find the layer which has the highest impact on performance since there are many components involved like network, database, application server and so forth. Therefore it requires close collaboration between software testers and developers for the sake of identifying and resolving bottlenecks in the backend and infrastructure.
We used JMeter
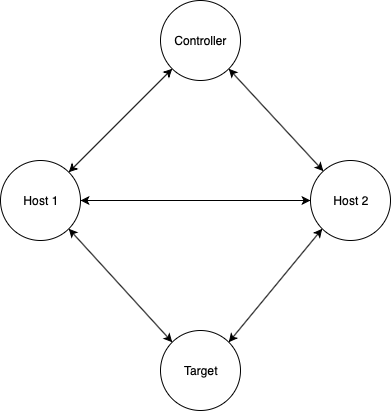
Apache JMeter is an open source tool which provides all necessary functionalities in order to perform a meaningful load test. Sometimes a realistic scenario means that more than 1000 concurrent users will use your application in a live situation. Therefore it is possible to run a distributed load test where multiple machines are sending simultaneous requests to a target server.

You can find more information about distributed load testing with JMeter here:
Load Test in a real project situation
On a recent project, we analysed various user paths and scenarios to identify the critical ones. As a result, we shifted our focus to two different endpoints, where we expected the highest amount of requests in a short period. Our goal was to achieve reasonable response times under constant heavy load and therefore aligned our performance goals with APDEX (Application Performance Index), which calculates the ratio between users who are above and below a certain threshold. In our project the “toleration threshold” was set to 500 ms, which resulted in an APDEX value of 0.63. ( 1 = full user satisfaction, 0 = no user satisfaction).
You can find more information about APDEX here:
As a consequence, database queries were optimised and a caching solution was implemented in the backend in order to come close to our desired performance goal. Eventually we reached an APDEX value of 0.75, which is much better but still leaves room for improvement.
Lessons learned
Once we had started multiple virtual machines to run a distributed load test, we quickly noticed that JMeter consumes a lot of machine resources to allocate 1000 users. Therefore we had to start more VM´s than planned, in order to achieve the desired number of users, which results in unexpected expenses. We tried to optimise the setup by starting load tests only in non GUI mode without any noticeable effect. JMeter is a great tool for recreating complex user paths with a lot of useful tools to create statistic reports and graphs, but for the purpose of simple measurement of response times we will do some further research to find other solutions.
One possibility is to perform HTTP benchmarking , in case there is no necessity to create dedicated user paths or scenarios which makes sense if you want to get a first impression of your endpoint´s performance.
Example of HTTP benchmarking with Apache Bench
The following example shows the report that apache bench will print into the console after firing 1000 requests with 10 virtual users to an endpoint:
ab -n 1000 -c 10 https://localhost/api/loadtest?query=test

[1] 39896
Michaels-MacBook-Pro:bin michael$ This is ApacheBench, Version 2.3 <$Revision: 1826891 $>
Copyright 1996 Adam Twiss, Zeus Technology Ltd, http://www.zeustech.net/
Licensed to The Apache Software Foundation, http://www.apache.org/

Benchmarking localhost (be patient)
Completed 100 requests
Completed 200 requests
Completed 300 requests
Completed 400 requests
Completed 500 requests
Completed 600 requests
Completed 700 requests
Completed 800 requests
Completed 900 requests
Completed 1000 requests
Finished 1000 requests


Server Software:
Server Hostname:        https://localhost
Server Port:            443
SSL/TLS Protocol:       TLSv1.2,ECDHE-RSA-AES256-GCM-SHA384,2048,256
TLS Server Name:        https://localhost

Document Path:          /api/loadtest?query=test
Document Length:        4994 bytes

Concurrency Level:      10
Time taken for tests:   19.418 seconds
Complete requests:      1000
Failed requests:        0
Total transferred:      5306000 bytes
HTML transferred:       4994000 bytes
Requests per second:    51.50 [#/sec] (mean)
Time per request:       194.177 [ms] (mean)
Time per request:       19.418 [ms] (mean, across all concurrent requests)
Transfer rate:          266.85 [Kbytes/sec] received

Connection Times (ms)
              min  mean[+/-sd] median   max
Connect:       88  128  20.1    125     391
Processing:    38   63  27.7     57     383
Waiting:       35   58  27.4     52     376
Total:        137  190  37.2    182     499

Percentage of the requests served within a certain time (ms)
  50%    182
  66%    190
  75%    196
  80%    202
  90%    221
  95%    246
  98%    317
  99%    368
 100%    499 (longest request)

